This system is easy to personalize and helps you gain insights into your patterns, making it a great tool for planning and self-awareness.

The foundation of a great Year in Pixels spread starts with the right layout. A grid with 12 columns for months and 31 rows for days works well, giving you a clear snapshot of the entire year [1].
For larger journals, go with a horizontal layout (12 columns × 31 rows). If you’re working with a smaller journal, a vertical layout (31 rows × 12 columns) might fit better. Alternatively, split the grid across two pages if space is tight.
Once you’ve picked your layout, get your tools ready and start crafting your spread.
To set up a polished and functional spread, gather the following:
A clean and structured layout ensures your Year in Pixels remains a practical tool for tracking and reflecting on your moods throughout the year.
"Knowledge is power, and this is the ultimate mood tracker to give me insight into the wild animal that is my daily mood." [1]
Once your grid is ready, it’s time to design a color-coding system that matches your personal goals and preferences.
Choose a simple color system to make your Year in Pixels both meaningful and easy to read. Stick to 3-5 colors to avoid confusion and keep things clear [1].
| Emotion | Color |
|---|---|
| Joy/Happiness | Yellow |
| Calm/Content | Green |
| Anger/Frustration | Red |
| Sadness/Low mood | Gray |
| Anxiety/Stress | Purple |
For tracking habits and productivity, assign colors to specific outcomes:
| Activity | Color |
|---|---|
| High Productivity | Blue |
| Exercise Complete | Green |
| Missed Goals | Red |
This method not only helps you monitor progress but also pinpoints areas needing attention, making your Year in Pixels a tool for reflection and planning.
Here are some tips to keep your color system effective:
For example, a writer could use different shades of blue to represent word count achievements, while a student might opt for various greens to track study hours completed.
Once your color system is ready, focus on updating it daily to get the most out of your Year in Pixels.
The key to staying consistent is making updates part of your daily routine. Pick a time that naturally fits into your schedule, like during evening reflection or when setting up the next day’s plan in your bullet journal.
To help you stick with it, try setting a phone reminder, using a bookmark to easily find the page, or keeping your journal somewhere you’ll see it often.
Position your Year in Pixels close to other spreads, such as monthly logs, habit trackers, or gratitude logs. This setup makes it easier to spot patterns between your emotions, activities, and overall experiences.
"Try to add them into your regular routine, alongside other daily journaling" [2].
Linking your Year in Pixels with other spreads creates a more connected system, helping you recognize trends and adjust as needed.
Even with this approach, challenges can pop up – here’s how to handle them.
Everyone faces hurdles, even seasoned bullet journal users. If you miss a day or two, check past entries or your calendar to fill in the gaps.
If space runs out, you can use smaller squares, create a separate spread for notes, or add details in the margins.
Keep in mind, the goal of your Year in Pixels isn’t just about tracking – it’s a tool for building emotional awareness and managing your feelings more effectively.
Take a close look at your Year in Pixels to uncover trends. Pay attention to clusters of similar colors and recurring themes over different periods, like weekly cycles, monthly patterns, or seasonal shifts.
For example, clusters of red pixels might point to regular stress around monthly deadlines. On the flip side, streaks of green or blue pixels could highlight your most productive or happiest times, giving you clues about what boosts your well-being.
Use what you’ve noticed to make real changes. If winter months show a dip in your mood, consider steps like using light therapy or spending more time outdoors to counteract it.
Here’s how to connect patterns with actions:
| Pattern | Suggested Action |
|---|---|
| Peak productivity in the morning | Schedule key tasks before noon |
| End-of-month stress | Add buffer days to your deadlines |
These steps help turn your insights into practical improvements for your daily life.
Refine your tracking method over time. You might want to simplify by merging rarely used colors or expand your palette for more detail. Adding notes about specific events or stress triggers can also make your tracking more insightful.
Your Year in Pixels should grow with you. Focus on tracking what truly helps you adjust habits or make better decisions.
"Experts recommend taking a holistic approach to reviewing the spread, looking for patterns and trends rather than focusing on individual days" [1].
A Year in Pixels spread turns daily tracking into a simple yet effective way to spot patterns and plan for the future. By taking just a few moments each day to update your pixel, you create a visual snapshot of your year, revealing trends and behaviors you might not notice otherwise. This habit not only encourages mindfulness but also provides insights you can act on.
What makes this system so appealing is how easily it can be customized. Whether you’re tracking your mood, habits, or productivity, the Year in Pixels approach can be tailored to fit your goals.
Here are some examples of how you can organize your tracking:
| Tracking Focus | Color System |
|---|---|
| Mood Tracking | 5-7 colors for different emotions |
| Habit Building | 3-4 colors to show progress levels |
| Productivity | Traffic light system (red/yellow/green) |
Each approach helps you clearly see progress and pinpoint areas that might need adjustment, making it easier to refine your habits and routines.
Think of your Year in Pixels as a dynamic tool. Staying consistent, reflecting regularly, and being open to adjustments are essential [1]. By combining daily updates with periodic reviews, you’ll gain a clearer picture of your patterns and cycles. This understanding can guide you in making smarter choices about your habits, routines, and long-term objectives.
Every colored square tells a story – a moment in time that contributes to better self-awareness and more intentional living.
Here are answers to some common questions about using a Year in Pixels to track and reflect on your year.
A Year in Pixels allows you to monitor daily metrics that align with your goals. The idea is to keep it simple and consistent to gain useful insights [1]. Below is an overview of what you can track:
| Category | What to Track | Color System |
|---|---|---|
| Mood | Joy, neutral, stress, anxiety | 5-7 distinct colors |
| Health | Sleep quality, exercise, symptoms | 3-4 contrasting shades |
| Habits | Reading, meditation, water intake | Two colors (done/not done) |
| Productivity | Work focus, task completion | Traffic light system |
| Personal Growth | Learning activities, creativity | Simple gradient scale |
When deciding what to track, keep these points in mind:
Your tracking system isn’t set in stone – it can evolve based on your needs. Whether you’re observing mood trends, building habits, or boosting productivity, the Year in Pixels method can help support your growth [2].
The best way to start? Focus on just one or two key metrics. Once you’ve built a tracking habit, you can gradually add more categories. This keeps the process manageable while still giving you valuable insights.
Stickers Made for Planning
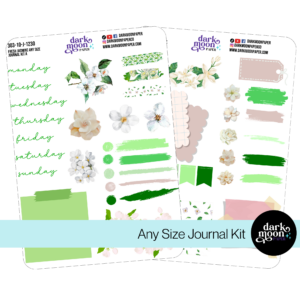
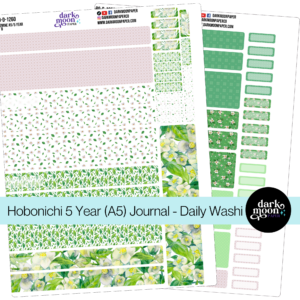
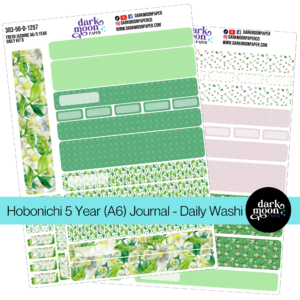
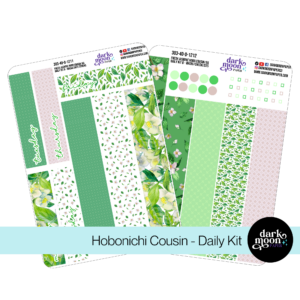
Our custom stickers are a fuss-free way to brighten up your planner pages with perfectly-sized designs that add a spark of personality to every layout.

Why use planner stickers?
Planner stickers make organizing easy, fun, and personal! Add color, creativity, and structure to every page, transforming your planner into a tool that reflects you. Perfect for tracking, decorating, and staying inspired daily!
Hello and welcome!
I’m Rachael Snow, a lifelong artist and entrepreneur, and I started Dark Moon Paper to blend my love of art, technology, and the mysterious beauty of the world around us. My sticker kits are meant to set the mood, tell a story, and give you a little escape from the ordinary.
I work from my cozy studio tucked away in the beautiful woods of Oregon, surrounded by nature and a dark night sky full of stars.